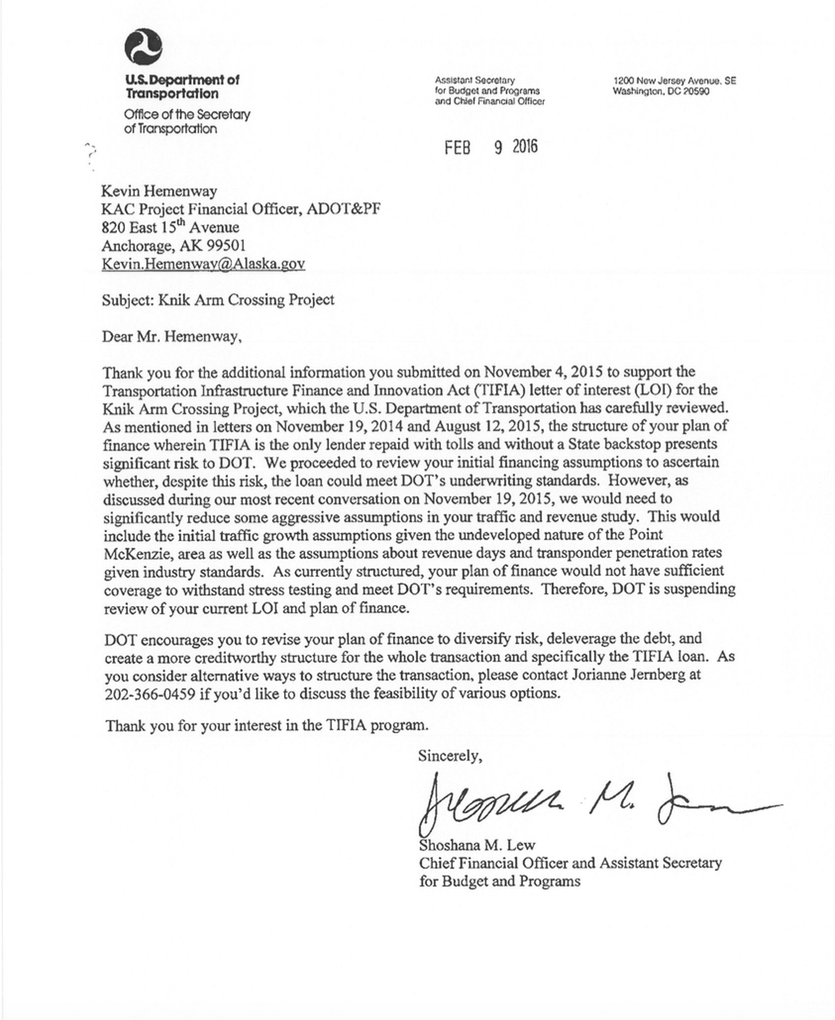
Walking back his January, 2015 decision [Online at Juneau Empire OR archived copy here]. (PDF 70kb)
to halt spending on the megaprojects of the Juneau Road, Susitna Dam,
and the Knik Arm Bridge, Governor Walker in July amended his earlier
administrative order to allow further spending on the projects (see here at ADN OR archived copy here. (PDF 111kb) and here at ADN OR archived copy here. PDF 106kb) for details).
The Governor’s decision allows the Knik Arm Bridge and Toll Authority
(KABATA) project team (now housed in the Alaska Department of
Transportation and Public Facilities (AKDOT) to apply for a $378 M
federal TIFIA loan and a $15 M federal TIGER grant that could launch
what AKDOT estimates is a $1.15 Billion project. If the federal money is
acquired, 2014 Legislation allows the project to move forward requiring
only the approval of the state’s bond committee. Click here [ Dead link- the KABATA website is no longer online ]. for the AKDOT/KABATA project letter of interest application.
Knik Arm Crossing proponents state that Toll Revenues will be enough
to pay back the TIFIA Loan. They also predict that toll revenues will
eventually be high enough to make the State-Issued Bonds payments
(although AKDOT/KABATA does admit that initially, the state will need
cover the bond payments).
In stark contrast, we believe that analysis shows that toll revenues will be approximately only one quarter
of the revenues predicted by AKDOT/KABATA. With just one quarter of
the estimated tolls coming in, the Knik Arm Bridge will require annual
subsidies from the State of Alaska to pay for: Operations &
Maintenance, TIFIA loan payments, and servicing of the State-issued
Bonds.
Below is a list of the AKDOT/KABATA toll revenue forecast flaws:
- The Knik Arm Bridge traffic estimates performed for the Wasilla
Bypass project were predicted to be 9,000 Average Daily Trips (ADT) in
2035, versus 36,000 ADT predicted by AKDOT/KABATA. 9,000 average trips
is one quarter of AKDOT’s/KABATA’s estimate and is also what we predict.
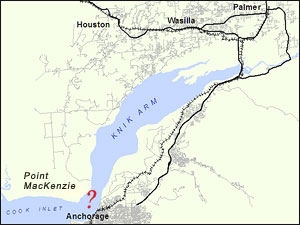
- AKDOT’s/KABATA’s population forecasts for the Point MacKenzie area
are 80% higher than forecasts performed for AKDOT’s Wasilla Bypass
project.
- AKDOT’s/KABATA’s population estimates rely on growth assumptions
that have not yet occurred in the Mat-Su Borough, and that will
significantly raise taxes and raise the price of housing in the Point
MacKenzie area.
- AKDOT’s/KABATA’s previous population and employment predictions used wildly different assumptions than their current “model”.
- AKDOT’s/KABATA’s financial plan still relies on toll revenues from
traffic volumes than can only be accommodated by a 4-lane bridge. But
the costs in the financial plan reflect the only the costs of building a
2-lane bridge.
KABATA/ADOT Application Predicts 60% More Growth in Mat Su than State Demographer
Whether the state can pay off the proposed federal TIFIA and TIGER
loans and $287 M in state bonds needed to finance the project, depends
largely on how many people live near the Bridge and are willing to pay a
one-way $5 toll (rising 2.5% a year). The population estimates performed by AKDOT/KABATA [ Dead link- the KABATA website is no longer online ].consultants included in the federal application, is for 207,888 people in the Mat Su Borough in 2040. (p. 25 ).
Again, in stark contrast, Eddie Hunsinger, the Alaska state
demographer, in April 2014, projected 166,338 people in the Borough in
2042. Also, the Anchorage Metropolitan Transportation Solutions (AMATS)
adopted a 2040 population estimate of 155,000 from a McDowell report to
be used for the upcoming Anchorage transportation plan.
With about 98,000 people in the Mat Su Borough today, the population figure used for the federal loan application projects over 60% higher growth rate in the Borough in 2040 than either the state demographer or AMATS. Click here for visuals
developed by ISER’s Scott Goldsmith and Jamie Kenworthy illustrate the
large differences between the Bridge proponent’s population number and
other sources.
“Futuristic Concepts”, Quite Different from Reality
Neither the state’s official population projection nor the AMATS
projection was provided to the federal TIFIA loan officials by
AKDOT/KABATA. However the application included a “poster [ Sadly, this is a Dead link- the KABATA website is no longer online].,”
of a “vision” of proposed “townsites” near the Bridge from a February
2014 study paid for by the Mat Su Borough. The disclaimer included on
that poster states: “This map illustrates a futuristic concept to be
used for discussion and generalized planning purposes only.” The poster
indicates the difficulty that AKDOT/KABATA has in getting the
population density that they need, using the lot sizes that are typical
for the Borough.
Outside of the Palmer/Wasilla core area, almost all of the Mat-Su
Borough has been and is being developed using well and septic systems
that require a minimum 1 acre lot size. To pack enough people near the
Kink Arm Bridge (where it actually might make financial sense to pay a
toll instead of using the free Glenn Highway), AKDOT/KABATA is instead
predicting that the vast majority of new homes being built will have 2, 3
or even 5 dwellings per acre. There was some additional capacity built
into the water treatment plant and sewage treatment plant for the Goose
Creek Correctional Center, but it is clear that the available capacity
would not be enough to support what is envisioned at the Point MacKenzie
townsite. The poster also indicates that the Mat-Su Borough and the
state (along with private developers) would be responsible for the costs
of building additional roads, schools, water treatment and sewer plants
necessary to support the population density projected by AKDOT/KABATA.
Since the Mat-Su Borough has struggled to pay for updating their current
sewage treatment plants, it is highly unlikely that Mat-Su voters will
authorize the tax increases to pay for the 6 or 7 new water and sewer
treatment plants needed for this “futuristic concept” to come true!
Unfortunately for AKDOT/KABATA, those small lots and higher costs take
away the major reasons people move to the Mat-Su Borough, cheaper
housing costs, and a bigger piece of land to call your own. The need for
new schools (Fire & Police Stations also) out on Point MacKenzie
well before there is enough population to fill those schools will result
in higher taxes in the Mat-Su Borough, further dampening growth rates.
AKDOT’s/KABATA’s Consultants “tweak” assumptions to create requisite cash flow – The Tail Wags the Dog.
We have previously pointed out the number of wildly different
scenarios that AKDOT/KABATA and their consultants have created over the
years to pump up needed toll revenues. For example: In 2012, we
identified a striking inconsistencies in KABATA’s job predictions The
estimate of the jobs in 2035 in the same two Traffic Analysis Zones
(TAZ) on the Mat-Su side of the Bridge, was 13,828 in their 2011
prediction, but only 6,740 jobs in their 2007 prediction. And there was
no explanation of the difference.
So where did that inexplicable doubling of jobs come from between
2007 and 2011? In 2007, KABATA forecasted Mat-Su’s 2030 population at
250,700? But in 2011 they forecasted the population at 200,000 in 2035 –
a decrease of 5,000 even with an extra five years. So, with less
population, but still needing to show high traffic counts, it appears
that KABATA’s 2011 forecast manufactured a doubling of jobs at Point
MacKenzie in order to justify both north and south bound traffic
crossing the bridge. Assuming that there will be high levels of 2
way-traffic to “go to work” and go shopping at a massive mall and or to
go to work at a huge new business center, was clearly an attempt to
justify their predicted high toll revenues. The 2007 job estimates even
included a Mall 2.4 times the size of the Dimond Center.
It is likely that reality will look different, because those same two
TAZ zones are in the area at Point MacKenzie currently set aside for
heavy industrial use. Those millions of square feet of retail shopping
areas are completely incompatible with the Point MacKenzie industrial
Special Use District (SPUD) that the Mat-Su Borough established in 2011.
That SPUD plan outlines land use consistent with the Pt. Mac Bulk
Commodities Port: mineral and forest products processing, a
petrochemical plant, metal fabrication for oil and gas modules, laydown
yards to store pipe for the gas pipeline, power generation and other
manufacturing industries. A possible liquefied natural gas (LNG) plant,
coal loading, and tank farms are also proposed uses clustered adjacent
to the Port. Clearly, homes and major business or retail areas should
not be built directly adjacent to hazardous industries like 7 million
gallon tank farms, LNG plants or coal loading/storage facilities.
Since KABATA’s 2014 socio-economic consultant showed a new population
of nearly 7000 people in what the SW Borough Futures poster show as the
Port MacKenzie Port Industrial Area (i.e. zero population), it shows
that KABATA’s consultant understood the toll revenue need for a higher
population near the Bridge, and assumed that the current Mat-Su Borough
regulations on the Port MacKenzie Special Use District (and common
sense) would be overturned to allow residential use adjacent to
hazardous industrial uses. For the entire Port MacKenzie area,
AKDOT/KABATA’s consultant is showing over 5 times the population that
AKDOT estimated for the Wasilla Bypass project (see discussion below).
Whether it was big Borough populations in 2007, big retail in 2007,
massive business/retail in 2011, or “futuristic” townsites and putting
homes and businesses in industrial areas in 2014, it is clear that
AKDOT/KABATA’s consultants continue to manipulate the numbers to
generate the cash flow predictions needed to cover loan and bond
payments.
A “Fresh Start”? Or still getting predictions that don’t pass the “Smell Test”?
A review of the state checkbook reveals that KABATA and AKDOT spent
over $1.3 Million in the last two years on new studies by their
consultants Agnew:Beck, Cardno, Inc, and CDM Smith. Agnew:Beck and
Cardno, Inc of Portland, Oregon produced new population and employment
forecasts which were the inputs to CDM Smith’s new traffic and toll
revenue estimates. CDM Smith is the traffic and toll estimating firm
that was criticized in the 2013 Legislative Budget and Audit for
“undocumented” and “overly optimistic” assumptions that led KABATA to
promise a “fresh start” on new numbers.
In 2014, CDM Smith estimated that there would be an average of 40,700
trips a day on the bridge in 2040. That number is essentially
equivalent to the 36,000 trips a day CDM Smith projected for 2035 in
2012. (In analyzing the proposed Wasilla Bypass, HDR Inc. projected
only 9,400 trips a day bridge in 2035 even though HDR also had a high
number for Borough growth; their 188,000 people in 2035 is consistent
with KABATA’s 208,000 in 2040.) Because Mat Su’s annual population
growth has slowed down to 2.3% a year since the 2010 Census, a skeptic
might suggest that KABATA’s continued persistence in showing much higher
population, trip and toll forecasts compared than all other sources is
driven by KABATA’s continuing need to show enough revenue to cover
expected Bridge obligations.
Will Pt MacKenzie Be the State’s 2nd Largest City? KABATA’s Consultant vs KABATA
To project enough toll revenue to pay off proposed Bridge obligations
requires both a high future Mat Su population and job growth and also
requires that much of that growth will not be in the Borough’s current
Palmer-Wasilla core but rather moved southwest to Pt MacKenzie at the
proposed northern terminus of the bridge.
KABATA’s consultant HDR is in a unique position of creating
socio-economic predictions for other AKDOT projects. HDR’s
socio-economic predictions for those other AKDOT projects are in
conflict with the predictions by Cardno / Agnew::Beck for AKDOT/KABATA.
HDR put only 7,177 people at Pt MacKenzie in 2040; the AKDOT/KABATA
number is over 5 times higher or 37,074 people. AKDOT/KABATA also
projected twice the number of jobs in 2040 than HDR at Pt Mac: 8,930
jobs vs. 4,511. A 37,074 population at Point MacKenzie in 2040
(compared to only about 1,700 there today) would make Point MacKenzie
the state’s second largest city, if Juneau and Fairbanks don’t grow much
larger than their 31,000 residents each today.
Scott Goldsmith and Jamie Kenworthy took the local neighborhood (or
Traffic Analysis Zone (TAZ) in transportation parlance) job and
population estimates, and broke them into local regions to graphically
illustrate the major differences between the Borough’s official
transportation plan done by HDR and the numbers AKDOT/KABATA provided in
their federal TIFIA “Letter of Interest” loan application. The numbers
dramatically differ on where people will live and work in the future
Borough between the numbers provided by DOT to the feds and the
Borough’s officially adopted transportation plan. Click here for population distribution (PDF 3.5MB) and here for location of jobs (PDF 3.6MB).
Still Showing “Impossibly Derived Revenue”
In 2013, we provided testimony to the Legislature pointing out that
KABATA was counting on toll revenues from traffic that can only fit on a
4-lane bridge, while showing costs of financing and constructing only a
2-lane bridge. Those 4 years of “Impossibly Derived Revenue” are what
we call the “2-lane cost/4-lane revenue” problem with KABATA’s past and
current financial schemes. AKDOT/KABATA Project Leader Judy Dougherty
has testified that traffic volumes greater than 20,000 ADT will result
in congestion. The 2015 Knik Arm Crossing TIFIA applications included an
effort by CDM Smith to respond to our criticism, and to calculate just
how much that “congestion” will affect traffic volumes, but the
application still relies on unusual assumptions that are clearly not
based on reality: reference pages 5-13 and 5-14 and Table 5-10 in CDM
Smith’s 12/5/14 Toll and Revenue report [ Dead link- the KABATA website is no longer online ].
For some background, the FHWA Traffic Manual indicates that 22,500
Average Daily Traffic (ADT) is approximately the maximum that can fit on
a 2 lane road or bridge. Exactly how traffic fluctuates over the course
of a typical day is the factor that requires that “approximately the
maximum” caveat. CDM Smith makes the following statement on page 5-13 of
their 2014 Traffic and Revenue Study: “Hourly distributions of traffic
were prepared using a combination of the period forecasts and the time
of day pattern of traffic counted on the Glenn Highway. The hourly
distributions were constructed so as to match the AWDT forecast and the
AM and PM peak period forecasts. The hourly volumes (for the average
weekday) were then constrained to a maximum hourly flow rate of 2,500
vehicles per hour. This process resulted in a 4.8% reduction in the AWDT
for 2030, an 11.3% reduction in 2035 and a 16.7% reduction in 2040. The
time-of-day pattern of traffic under these conditions is quite unusual.
Traffic volumes increase to the maximum flow rate early in the morning
and stay at that level throughout the day.”
CDM Smith’s statement doesn’t explain just how unusual that kind of a
traffic pattern really is: Actual traffic patterns measured on the
Glenn Highway in 2008 at the 6 lanes of Glen Highway traffic at the
Anchorage Scalehouse had 38.55% of the typical South-Bound work-day
traffic occurring between 6 and 9 am. Similarly, the North-Bound traffic
had 38.20% of the day’s traffic that traveled between 3 and 6 pm. The
Glenn Highway traffic at the Eklutna Flats was similar, and the hourly
average traffic flows on that 4-lane highway give some good comparison’s
to KABATA’s predictions:
For the hours ending at 7, 8 and 9 am, there were 2,352, 1,903 &
1,370 average hourly flows (both directions), and 1,928, 2,619 &
2,721 for the hours ending at 4, 5 & 6 pm. That average hourly
traffic did not exceed 1,400 vehicles per hour for the remainder of the
morning and afternoon, up until the evening “rush hour”. Compare those
actual traffic patterns on a 4-lane highway to AKDOT/KABATA’s
predictions that “Traffic volumes increase to the maximum flow rate
(2,500 vehicles/hour) early in the morning and stay at that level
throughout the day” on a 2-lane bridge. Commuters already complain about
“rush hour” traffic on the 4-6-lane Glenn Highway at average hourly
vehicle counts that are close to, or less than the vehicle counts that
AKDOT/KABATA predicts will be able to fit on a 2-lane bridge! Not only
is CDM Smith’s predicted traffic pattern NOT based on “the time of day
pattern of traffic counted on the Glenn Highway”, the idea that their
2-lane bridge can sustain 2,500 vehicles per hour at any time is highly
questionable.
Interestingly, the 29,386 ADT from 2008 Glenn Highway Traffic
patterns are still basically representative of Glenn Highway Traffic
today. The ADT at the Eklutna Flats measuring station has stayed at
approximately 30,0000 ADT for the past 5 years. Clearly the Mat-Su
Borough is developing its own jobs, reducing the bedroom community
patterns of the past. The Alaska Division of Commerce backs up that
information with statistics showing that the percentage of Mat-Su
residents commuting outside of the Borough for work (including the North
Slope, etc) dropped from 55% in 2011 to 44% in 2015.
Table 5-10 on page 5-14 of CDM Smith’s 2014 Traffic & Revenue
forecast indicates that even with the “constraints on the hourly flow
rates”, their revenue forecast still asserts that they can have 33,300
average daily traffic fitting on a 2-lane bridge in 2045, which is
clearly not possible.
Furthermore, at 25,000 vehicles a day, if you use the 2008 hourly
traffic rates measured on the Glenn Highway to estimate the hourly rates
on the Knik Arm Bridge, there would be so many cars trying to use the
bridge during “rush hour” that traffic would backup more than a mile on
either side of the bridge. At 33,300 ADT there could be 6 mile backups
in the morning and evening peak hours.
The AKDOT/KABATA paid over a million dollars for the CDM Smith report and those Toll Revenues form the basis for their 2015 TIFIA finance plan [ Dead link- the KABATA website is no longer online ].
The peak-non-peak flow in Anchorage shows the toll revenue projected
over about 20,000 ADT is physically impossible. CDM Smith’s prediction
that “Traffic volumes increase to the maximum flow rate early in the
morning and stay at that level throughout the day” is a wholesale
invention of a new traffic pattern for Anchorage where peak hours and
non-peak hours have almost the same level of traffic and congestion.
The statement from the Citi financial plan pg. 3 sent to TIFIA, “Toll
Revenue for Phase I is capped at the facility capacity and only grows
by inflation adjustment to toll rates from when that point is achieved”
is demonstrably untrue, since the revenue estimates come from CDM Smith
Table 5-10 where up to 33,300 vehicles a day cross a 2 lane bridge that
has a capacity of only 20,000 ADT.
What Happens Next? Why the Federal Loan Could be Approved
KABATA has been turned down for a TIFIA loan seven times at the
preliminary “Letter of Interest” stage. However when the legislature
passed HB 23 in 2013, it changed the financial structure from a public
private partnership to a direct state finance structure. And it added language [archived copy here]
(37.15.260 1 g ) to have the Revenue Commissioner report annually to
the legislature, stating the amount of money that will need to be
appropriated to cover all Bridge obligations. That requirement is
considered by bond attorneys to trigger a “moral obligation” of the
state to cover all toll shortfalls.
In that scenario, the legislature would have a tough choice each
session: appropriate enough funds to cover all bridge obligations or
trigger a default by a state department and risk an almost certain
downgrade to Alaska’s Credit Rating.
With the expected toll shortfall apparently guaranteed by a state
that for now has a AAA credit rating, TIFIA loan examiners may not care
how accurate AKDOT/KABATA’s population and toll revenue projections are
since the state is essentially on the hook as the backup creditor. All
of AKDOT’s/KABATA;s cost estimates have been based on a design that is
only 35% complete. As that design works towards being 100% complete, the
cost increases that are “normal” for a mega project of this scale
(along with the toll shortfalls) means that IF the Kink Arm Bridge is
built, Alaska could easily be looking a $2 billion hit to the State
Budget.
TIFIA has told Congress that existing appropriations allow about $9
billion a year of project financing that covers up to one third project
costs or TIFIA funds can launch about $27 billion of projects a year. A
review of current letter of interest applications [archived copy here.]
shows there may be too few projects chasing too much money. So the
“Bridge to Nowhere” could have a fair chance of passing the letter of
interest phase and moving to the credit analysis phase that often leads
to loan approval.
Aides to the Governor have assured this blog’s writers that the Knik
Arm Crossing, like the Juneau Road and Susitna Dam, is in a “parking
lot” awaiting consideration only by future administrations. But the Transportation Commissioner’s endorsement of the project [ Dead link- the KABATA website is no longer online ] and the active status of the TIFIA loan request sends a different signal.
The question for Alaska is: IF the TIFIA loan is acquired, can
Alaska afford to spend $2 Billion on a bridge to nowhere in an era of $5
billion dollar deficits?

